metacausal.plots.weights
- metacausal.plots.weights(source, *, ax=None, on_uniform='warn', sort=True)[source]
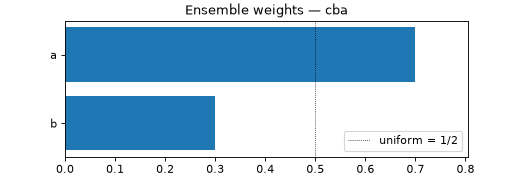
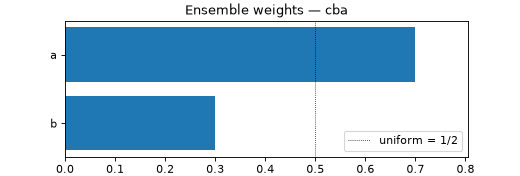
Bar chart of aggregation weights.
Works naturally on supervised aggregators (causal stacking, BMA, DR simplex, R-stacking, CBA) that produce informative weights. Pointwise aggregators (
Mean,Median,TrimmedMean) either expose no weights at all, or would produce uniform bars; seeon_uniform.- Parameters:
source (CausalEnsemble | EnsembleWeights) – Either a fitted
CausalEnsemble— the weights are read fromsource.aggregation.ensemble_weights— or a precomputedEnsembleWeightsinstance.ax (Axes | None) – Existing axes to draw on. If
None, a new figure is created.on_uniform (Literal['warn', 'error', 'ignore']) –
Behaviour when weights are effectively uniform (max pairwise deviation below a small tolerance):
"warn"(default): emit aUserWarningand render uniform bars."error": raiseValueError."ignore": render uniform bars silently.
sort (bool) – If
True, sort bars by descending weight. IfFalse, preserve the order inEnsembleWeights.model_names.
- Returns:
Axes – The axes the plot was drawn on.
- Raises:
ValueError – If
sourceis aCausalEnsemblewhose aggregation has noensemble_weights(pure pointwise strategies), or ifon_uniform="error"and the weights are uniform.- Return type:
Axes
Examples
Works directly on a standalone
EnsembleWeights(as produced by any supervised or agreement strategy’sensemble_weightsafter fitting), with noCausalEnsemblerequired for the plot itself:>>> from metacausal.aggregation import EnsembleWeights >>> from metacausal.plots import weights >>> ew = EnsembleWeights(weights=[0.7, 0.3], model_names=["a", "b"], method="cba") >>> ax = weights(ew) >>> ax.get_xlabel() 'Weight'
(
Source code,png)