metacausal.plots.cate_profile
- metacausal.plots.cate_profile(source, x, *, xlabel, ax=None, show_components=True, ylim=None, ensemble_label='Ensemble CATE')[source]
Ensemble CATE along one covariate, with optional bootstrap CI.
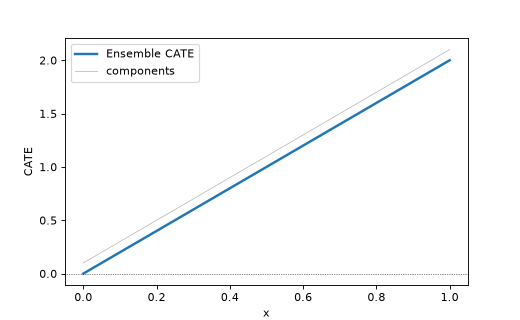
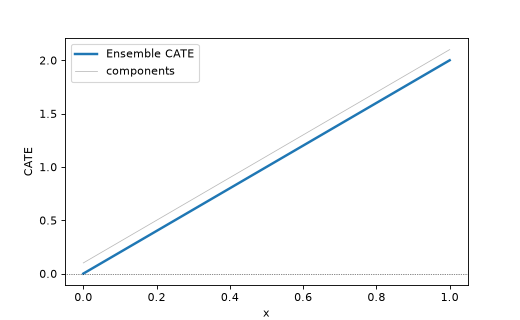
The x-axis is the varied covariate; the y-axis is CATE. Individual component CATEs are optionally overlaid in grey. A shaded
1 - alphapointwise CI is drawn only when aBootstrapResultis supplied.- Parameters:
source (BootstrapResult | CateEstimate) –
Either:
A
BootstrapResultproduced byCausalEnsemble.bootstrap(X_grid, ...)— draws the CI band plus ensemble and component lines. Must have a non-Nonecate.A
CateEstimateproduced byCausalEnsemble.cate(X_grid)— draws ensemble and component lines only, no band.
The grid length must match
len(x).x (np.ndarray) – Values of the varied covariate, shape
(grid_size,). These become the x-axis coordinates.xlabel (str) – Axis label for
x(e.g.,"re74 (1974 earnings)").ax (Axes | None) – Existing axes to draw on. If
None, a new figure is created.show_components (bool) – If
True, overlay per-component CATEs as thin grey lines. Only drawn whensourcecarries component estimates.ylim (tuple[float, float] | None) – Optional y-axis limits. Useful when a single component has extreme CATE values that compress the ensemble signal.
ensemble_label (str) – Legend label for the ensemble line.
- Returns:
Axes – The axes the plot was drawn on.
- Raises:
ValueError – If
sourcecarries no CATE data (e.g., aBootstrapResultwhosecateisNone), or iflen(x)does not match the grid length onsource.- Return type:
Axes
Examples
Works directly on a standalone
CateEstimate(as returned byCausalEnsemble.cate(X_grid)), constructed by hand here with a toy grid and a single component:>>> import numpy as np >>> from metacausal.estimators import CateEstimate, ComponentCateEstimate >>> from metacausal.plots import cate_profile >>> x = np.linspace(0, 1, 5) >>> result = CateEstimate( ... cate=x * 2, ... component_estimates={"a": ComponentCateEstimate(cate=x * 2 + 0.1)}, ... aggregation="Median", ... ) >>> ax = cate_profile(result, x, xlabel="x") >>> ax.get_ylabel() 'CATE'
(
Source code,png)